Design and Application of Power Monitoring System for Xianhong Cooked Food Processing Project
Ankerui Electric Co., Ltd., Jiading, Shanghai 201801, China;
Abstract : This paper introduces the power monitoring system of Xianhong cooked food processing project, and uses intelligent power meter to collect various electrical parameters and switching signals of the power distribution site. The system adopts the on-site local networking mode. After networking, it communicates through the fieldbus and travels to the background. Through the Acrel-2000 power monitoring system, the real-time monitoring and power management of the power distribution circuit of the substation is realized.
Key words : industrial projects; Xianhong cooked food processing project; substation; intelligent power meter; Acrel-2000; power monitoring system
0 Overview
This project is the power monitoring system of Xianhong cooked food processing project. According to the requirements of power distribution system management, it is necessary to carry out power monitoring on the high and low voltage power distribution room of Xianhong cooked food processing project to ensure the safety, reliability and efficiency of electricity consumption.
The Acrel-2000 low-voltage intelligent power distribution system makes full use of the development of modern electronic technology, computer technology, network technology and fieldbus technology, and performs distributed data collection and centralized monitoring and management of the variable power distribution system. The secondary equipment of the power distribution system is networked, and the field devices of the distributed power distribution stations are connected as an organic whole through the computer and the communication network to realize remote monitoring and centralized management of the power grid operation.
1 System structure description
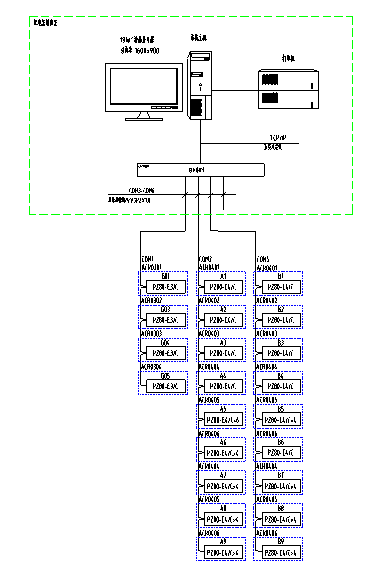
There are 51 PZ multi-function meters in this project. The collection device is placed in the power distribution room. The on-site multi-function instrument is connected to the corresponding acquisition device via 485 bus. The on-site serial server transmits the data to the monitoring host via the network cable.
The monitoring system adopts a layered distributed structure, that is, a station control layer, a communication layer and a space layer.
The interval device layer is mainly: multi-function network power meter, intelligent motor protector, and the like. These devices are respectively installed in the electrical cabinet corresponding to the corresponding primary equipment. These devices all adopt RS485 communication interface, and realize on-site data collection through the on-site MODBUS bus networking communication.
The network communication layer is mainly: industrial serial port server, its main function is to collect the scattered devices in the field, and remotely transmit to the station control layer to complete the data interaction between the field layer and the station control layer.
Station control management: equipped with high-performance industrial computers, monitors, UPS power supplies, printers and other equipment. The monitoring system is installed on the computer to collect and display the running status of the field device and display it to the user in the form of human-computer interaction.
The above field devices use RS485 interface and MODBUS-RTU communication protocol. RS485 adopts shielded cable transmission. Generally, two connections are used, and the wiring is simple and convenient. The communication interface is half-duplex communication, that is, both sides of the communication can receive and send data. Only data can be sent or received at the same time, and the data transmission rate is 10 Mbps.
2 main functions of power monitoring system
2.1 Data Acquisition and Processing
Data collection is the basis of power distribution monitoring. Data acquisition is mainly completed by the underlying multi-function network instrument, realizing local real-time display of remote data. The signals that need to be collected include: three-phase voltage U, three-phase current I, frequency Hz, power P, power factor COSφ, electrical Epi, and remote device operating status.
The data processing mainly displays the electric parameters collected as required in real time to the user, and achieves the automation and intelligent requirements of the power distribution monitoring, and simultaneously stores the collected data into the database for the user to inquire.
2.2 Human-computer interaction
The system provides a simple, easy to use, and good user interface. Using the full Chinese interface, the CAD graphic shows the electrical main wiring diagram of the low-voltage power distribution system, showing the status of the power distribution system equipment and the corresponding real-time operating parameters, the screen timing wheel patrol switching; the screen real-time dynamic refresh; analog quantity display; switch quantity display; continuous Record display, etc.
2.3 Diachronic events
The diachronic event viewing interface mainly provides convenient and friendly human-computer interaction for the user to view the fault records, signal records, operation records and over-limit records that have occurred. Through the historical event viewing platform, you can conveniently locate you according to your own requirements and query conditions. The historical events to be viewed provide good software support for you to grasp the operation of the entire system.
2.4 Database Establishment and Query
It mainly completes remote measurement and remote signal timing collection, and establishes a database to generate reports on a regular basis for users to query and print.
2.5 User Rights Management
For different levels of users, set different permission groups to prevent the loss of production and life caused by human error, and achieve safe and reliable operation of the power distribution system. Users can log in, log out, change passwords, add deletes, etc. through user management, which is convenient for users to modify accounts and permissions.
2.6 Operating load curve
The load trend curve function is mainly responsible for timing the incoming line and important loop current and power load parameters, and automatically generating the running load trend curve, which is convenient for the user to know the running load status of the equipment in time. Click the corresponding button or menu item to complete the corresponding function switching; you can view the real-time trend curve or historical trend line; you can perform translation, zoom, range conversion and other operations on the selected curve to help users enter the line trend analysis and fault recall. Analysis of the health of the entire system provides intuitive and convenient software support.
2.7 Remote Report Query
The main function of the report management program is to design the report style according to the needs of the user, and filter the data processed in the system to generate the report data required by the user. The program can also use the timed save, print or summon save and print mode for the report file according to the user's needs. At the same time, the program also provides users with the function of generating report file management.
The report has the function of freely setting the query time to realize the energy statistics, data export and report printing of day, month and year.
3 Case analysis
The incoming circuit uses the PZ96L multi-function power meter, which is a network power meter designed for power monitoring needs of power systems, industrial and mining enterprises, public facilities, and intelligent buildings. It can measure all conventional power parameters, such as three-phase voltage and current. , active power, reactive power, power factor, frequency, active power, reactive power. And the instrument has 4 photoelectric isolation switch input contacts and 2 relay control output contacts, these contacts can be used with the intelligent circuit breaker to realize the remote signaling and remote operation of the circuit breaker. This series of network power meters are mainly used in substation automation, distribution network automation, residential power monitoring, industrial automation, energy management systems and intelligent buildings.
The important distribution circuit adopts PZ80L series multi-function power meter, which mainly measures all conventional power parameters, such as: three-phase voltage, current, active power, reactive power, power factor, frequency, active power, and reactive power.
The secondary diagram of low-voltage power distribution is shown in Figure (1). The function has electric power telemetry. It mainly monitors the electrical parameters of the running equipment, including: line three-phase voltage, current, power, power factor, electric energy, frequency and other electrical parameters and the distribution loop. Three-phase current; the remote signal function realizes the operation status of the field device, including: the switch's branching and closing operation status and communication fault alarm; when the circuit breaker is displaced, an alarm signal will be sent to remind the user to handle the fault in time.
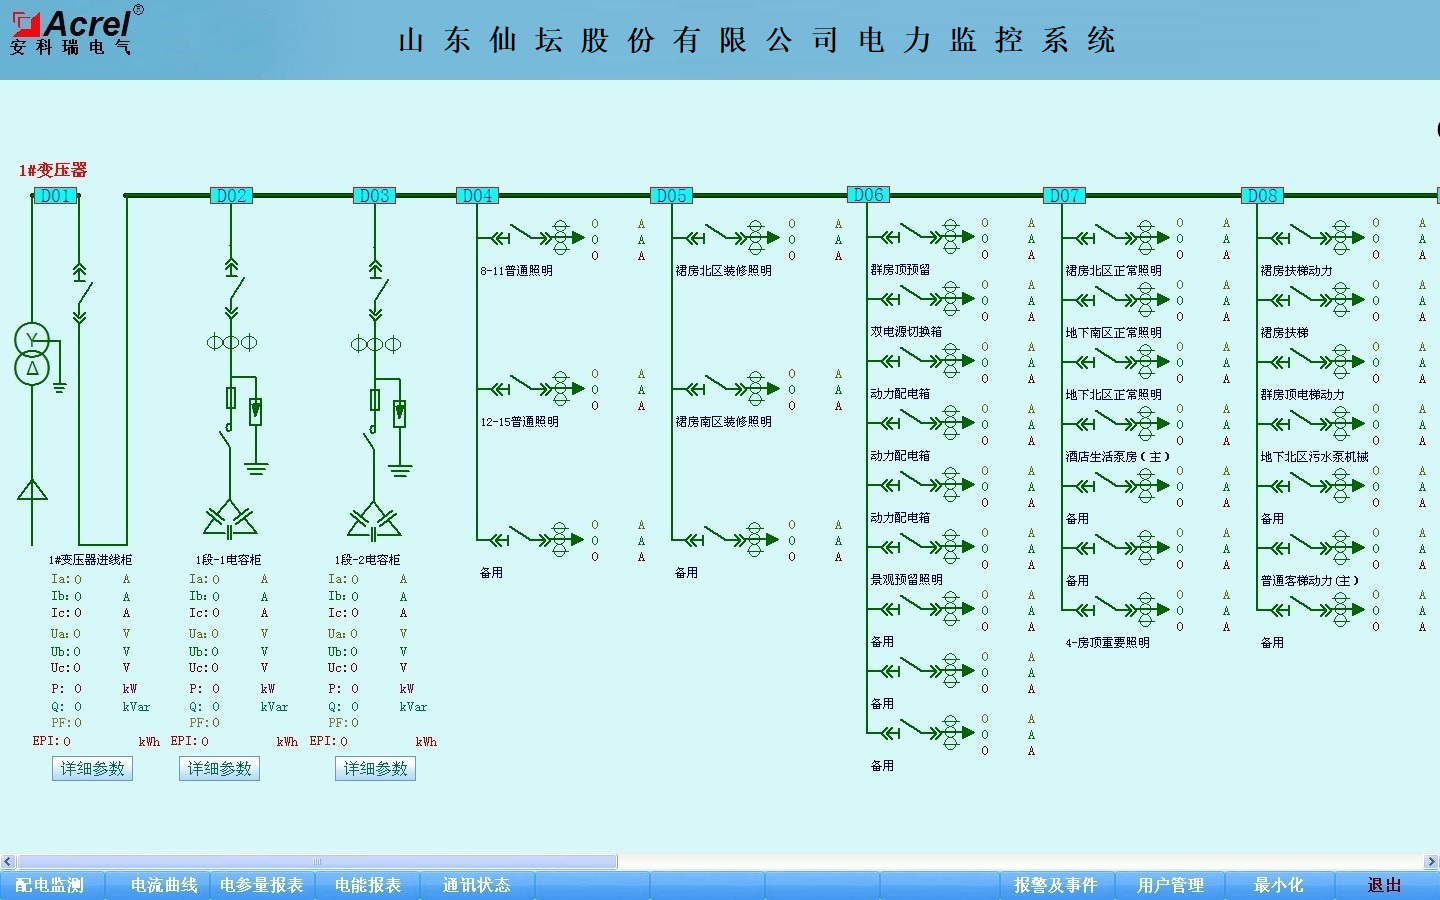
Figure (1) Secondary diagram of low-voltage power distribution
The parameter meter reading function mainly queries the electric parameters of the low-voltage outlet circuits. Supports electrical parameter query at any time, with functions such as data export and report printing. The report queries the electrical parameters of the low-voltage circuits of the four transformers in the two substations, including: three-phase current, active power, active power and transformer temperature. The loop name of the report is associated with the database, which is convenient for the user to modify the loop name. See picture (2).
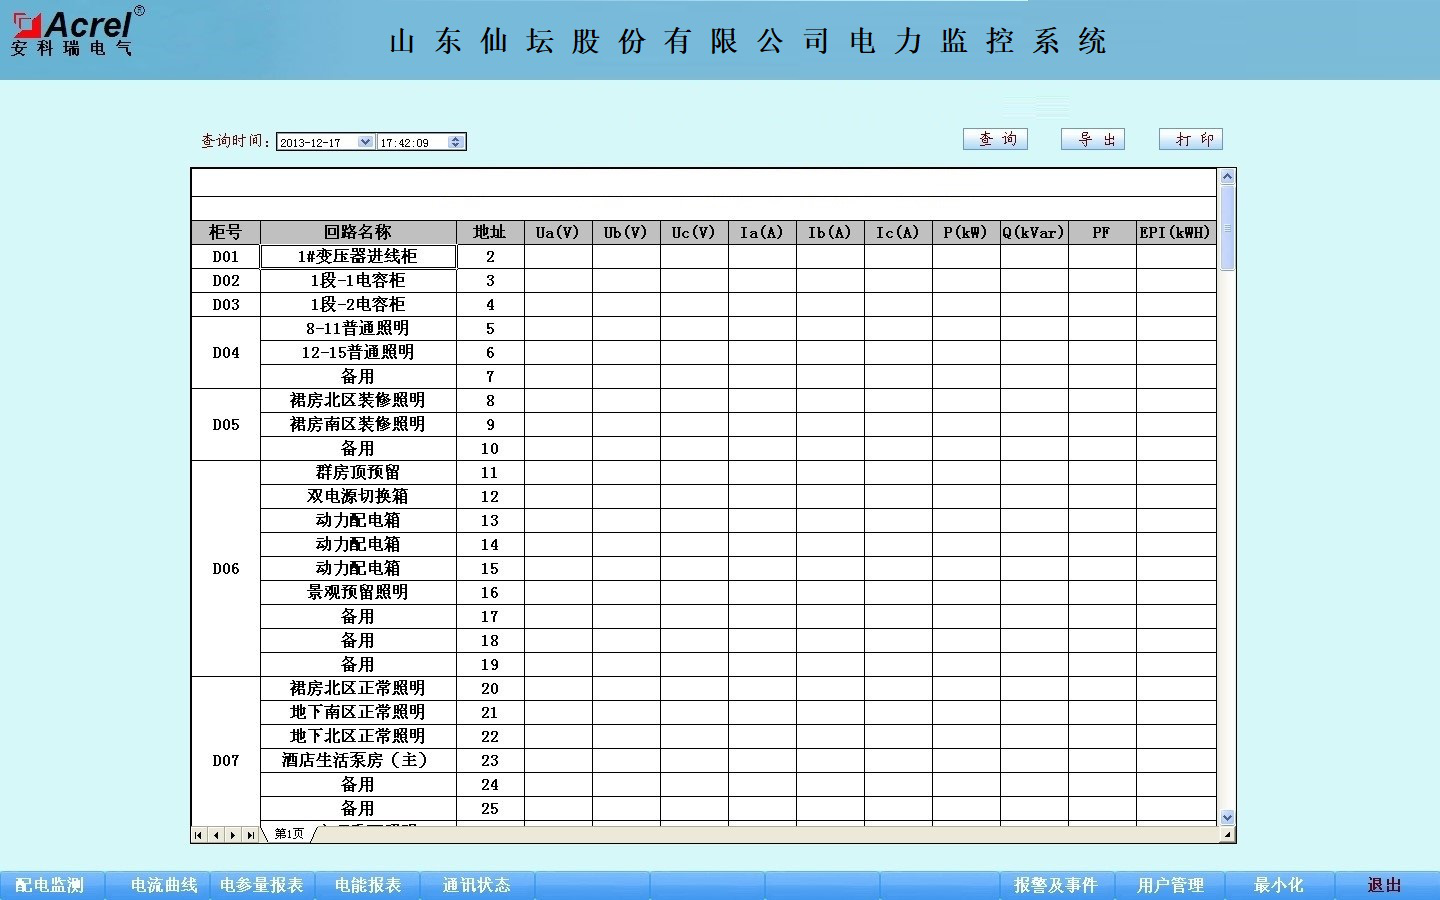
Figure (2) Parameter reading
The power consumption report function can select the time period for query, support the electricity cumulative query for any time period, and have the functions of data export and report printing. Provide accurate and reliable energy reports for duty personnel. The loop name of the report is associated with the database, which is convenient for the user to modify the loop name. As shown in the figure below, the accurate power consumption of each power distribution circuit in a certain period of time in the power distribution room is displayed. Users can directly print the report and save it to other locations in EXCEL format. See picture (3).
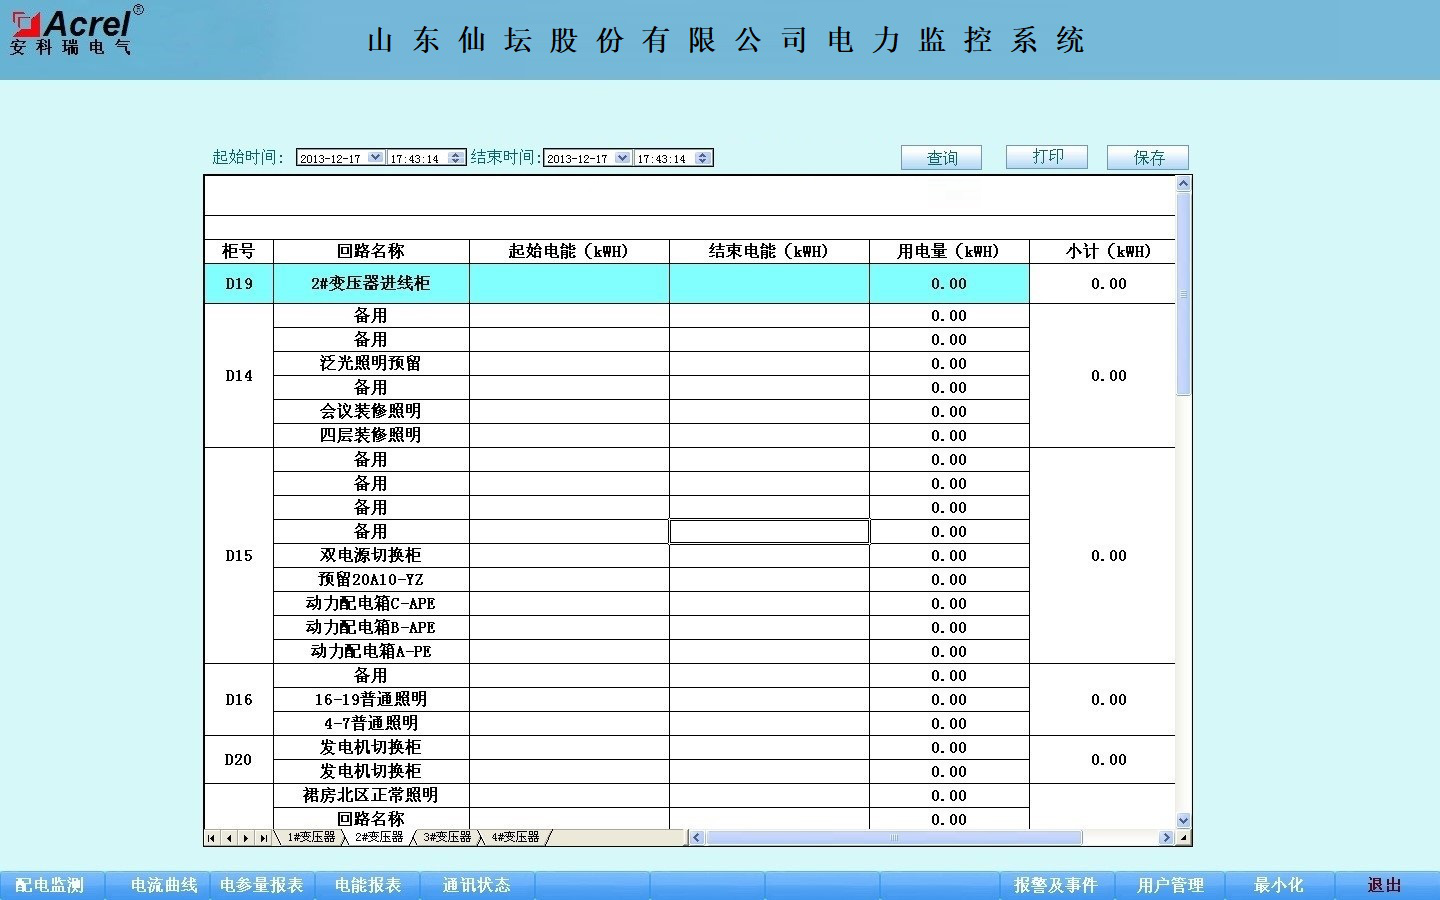
Figure (3) Energy report
   The schematic diagram of the system communication structure mainly shows the networking structure of the system. The system adopts a layered distributed structure and monitors the communication status of the interval layer devices. Red indicates normal communication and green indicates communication failure. See Figure (4).
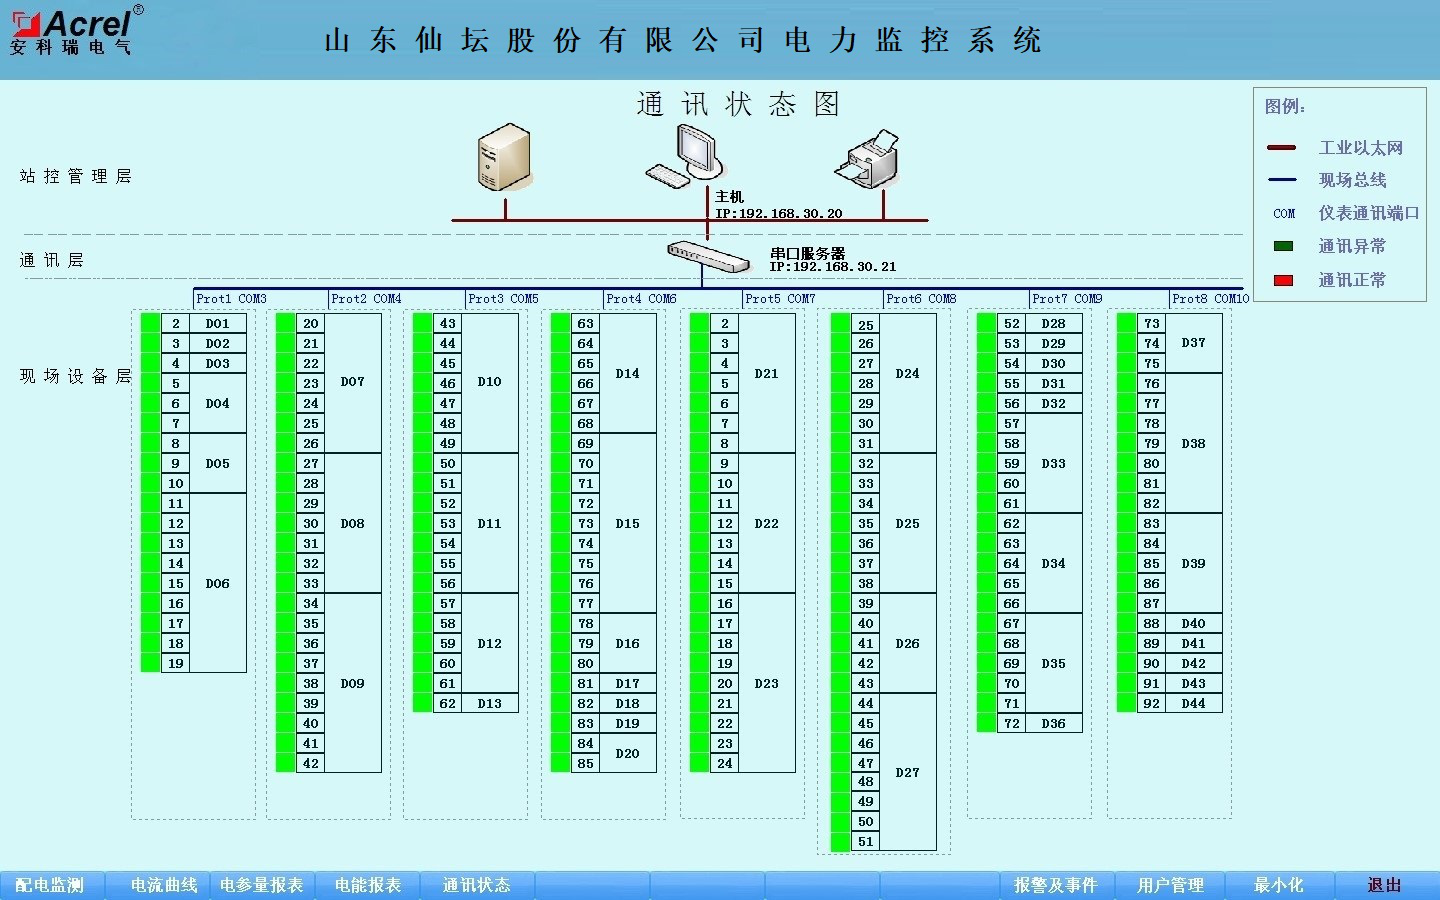
Figure (4) Schematic diagram of system communication structure
   The load trend curve interface can be used to visually check the load operation of the loop. View real-time and historical trend curves, click the corresponding button or menu item on the screen to complete the corresponding function switching; help users to enter the trend analysis and fault recall, with curve printing function. Provides intuitive and convenient software support for analyzing the health of the entire system. See picture (5).
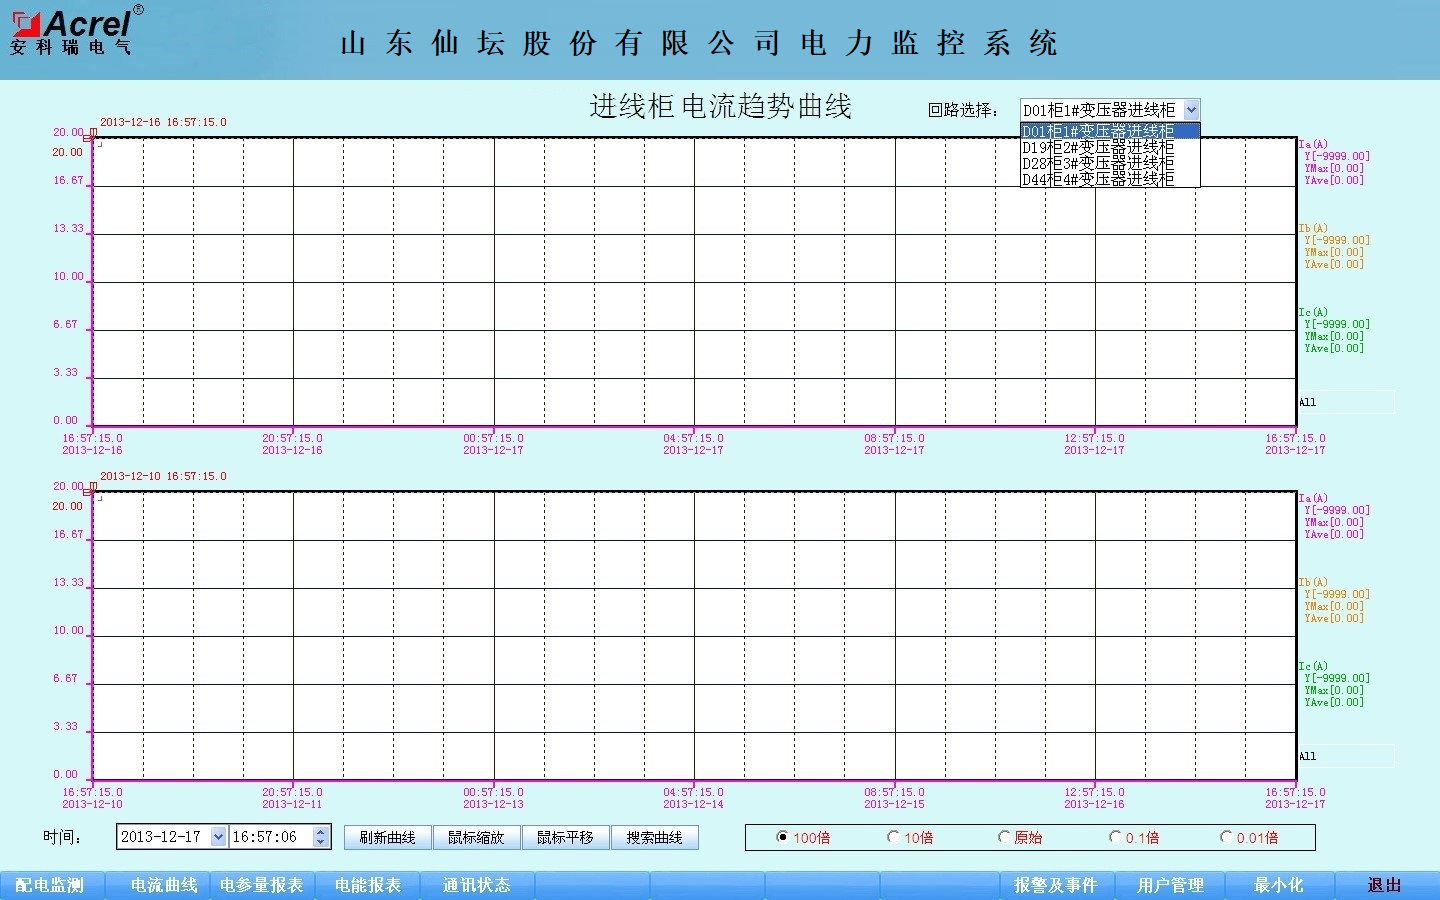
Figure (5) trend graph
4 Conclusion
   With the development of society and the wide application of electric power, the power monitoring system has become an inevitable choice for large-scale multi-substation users such as key projects, landmark buildings/large public facilities throughout the country. The Acrel-2000 power monitoring system introduced in this paper In the application of Xianhong cooked food processing project, real-time monitoring and power management of the power supply of the low-voltage distribution circuit of the substation can be realized. It can not only display the power consumption of the loop, but also has the network communication function, which can be connected with the serial server, computer, etc. Form a power monitoring system. The system realizes the analysis and processing of the collected data, displays the running status of each distribution circuit in the substation in real time, and has pop-up alarm dialog box and voice prompt for the closing and closing of the load, and generates various energy reports, analysis curves, Graphics, etc., facilitate remote meter reading and analysis and research of electrical energy. The system is safe, reliable and stable, and provides a reliable and reliable basis for the users of the substation to solve the problem of electricity consumption, and has achieved good social benefits. [2]
1.Construction of SAE 100 R3AT
-Tube: Black, oil resistant, synthetic rubber.
-Reinforcement: Two fiber braids of reinforcement.
-Cover: Oil and environment resistant synthetic rubber.
3.Constant operation: -40 °C +100 °C (-40 °F +212 °F)
Air max T = +70 °C (+160 °F) Safety factor: 1:4
4.Length: random
5. Application: medium pressure hydraulic lines, fuel oil, antifreeze solutions, air, and water.
High Pressure Flexible SAE100 R6 Hydraulic Hose For Oil Fuel Delivery
APPLICATIONS:
Low pressure lines, return lines, drain lines
Mineral oils, vegetable and rape seed oils, glycol and polyglycol based oils, synthetic ester based oils, oils in aqueous emulsion, water
SAE 100 R3 + R6, Synthetic Rubber Hydraulic Hose R3, Rubber Hydraulic Hose R6, Synthetic Rubber Hydraulic Hose R6
Hebei Orient Rubber & Plastic Co., Ltd. , https://www.hiteckhose.com